RF Signal Processor Demo
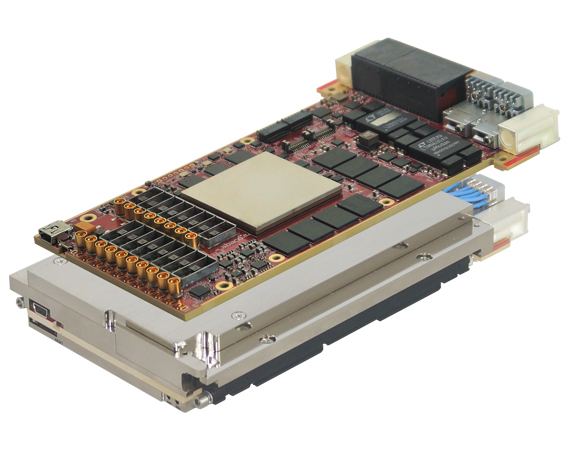
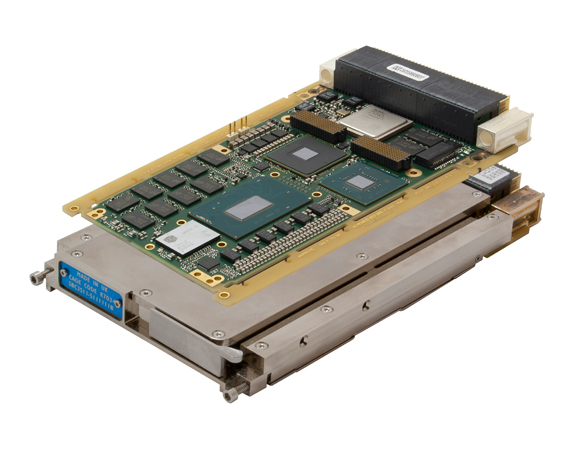
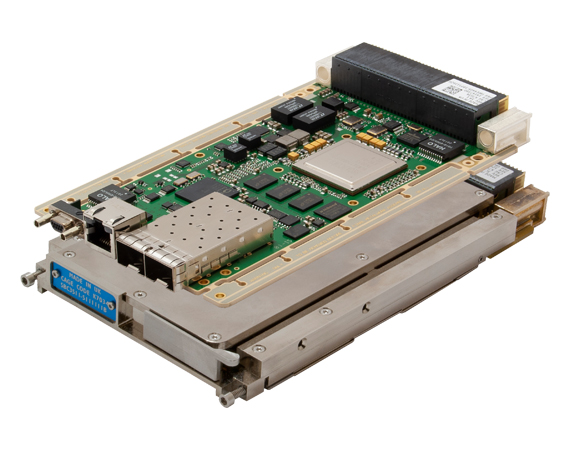
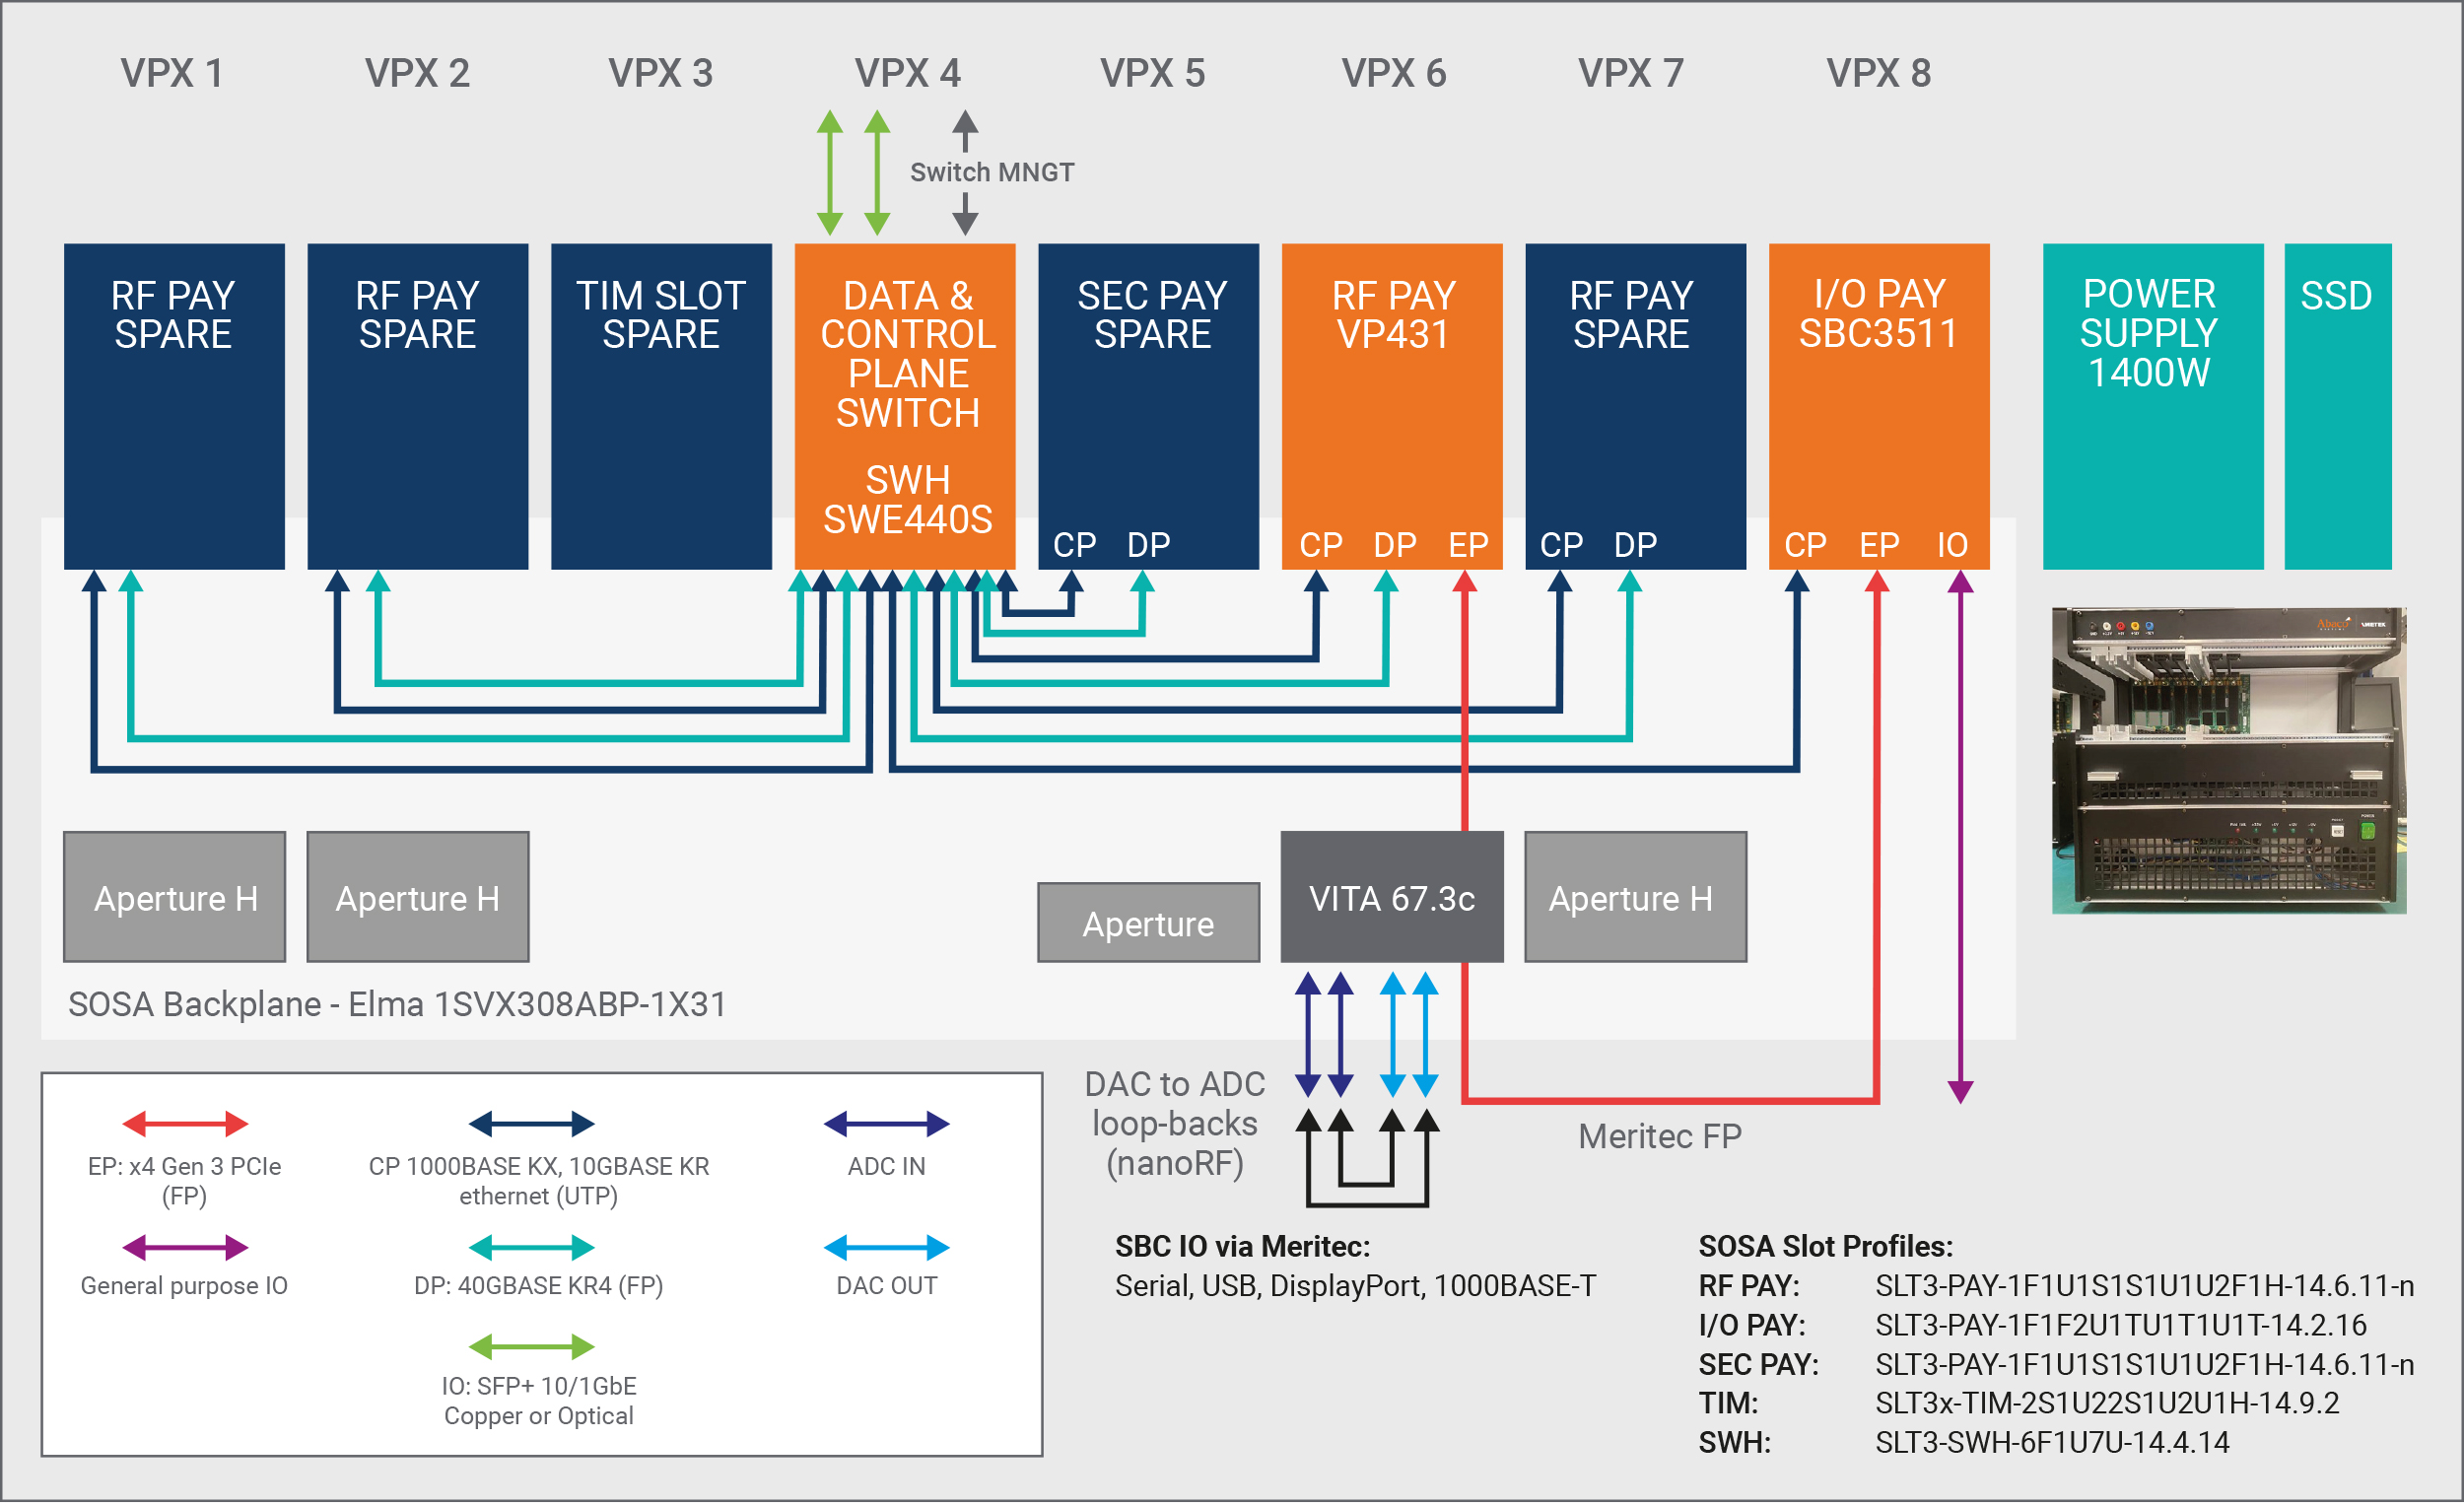
SOSA 3U Development System with Elma 3U Short 25 Gb/lane backplane
RF Signal Processor Demonstration
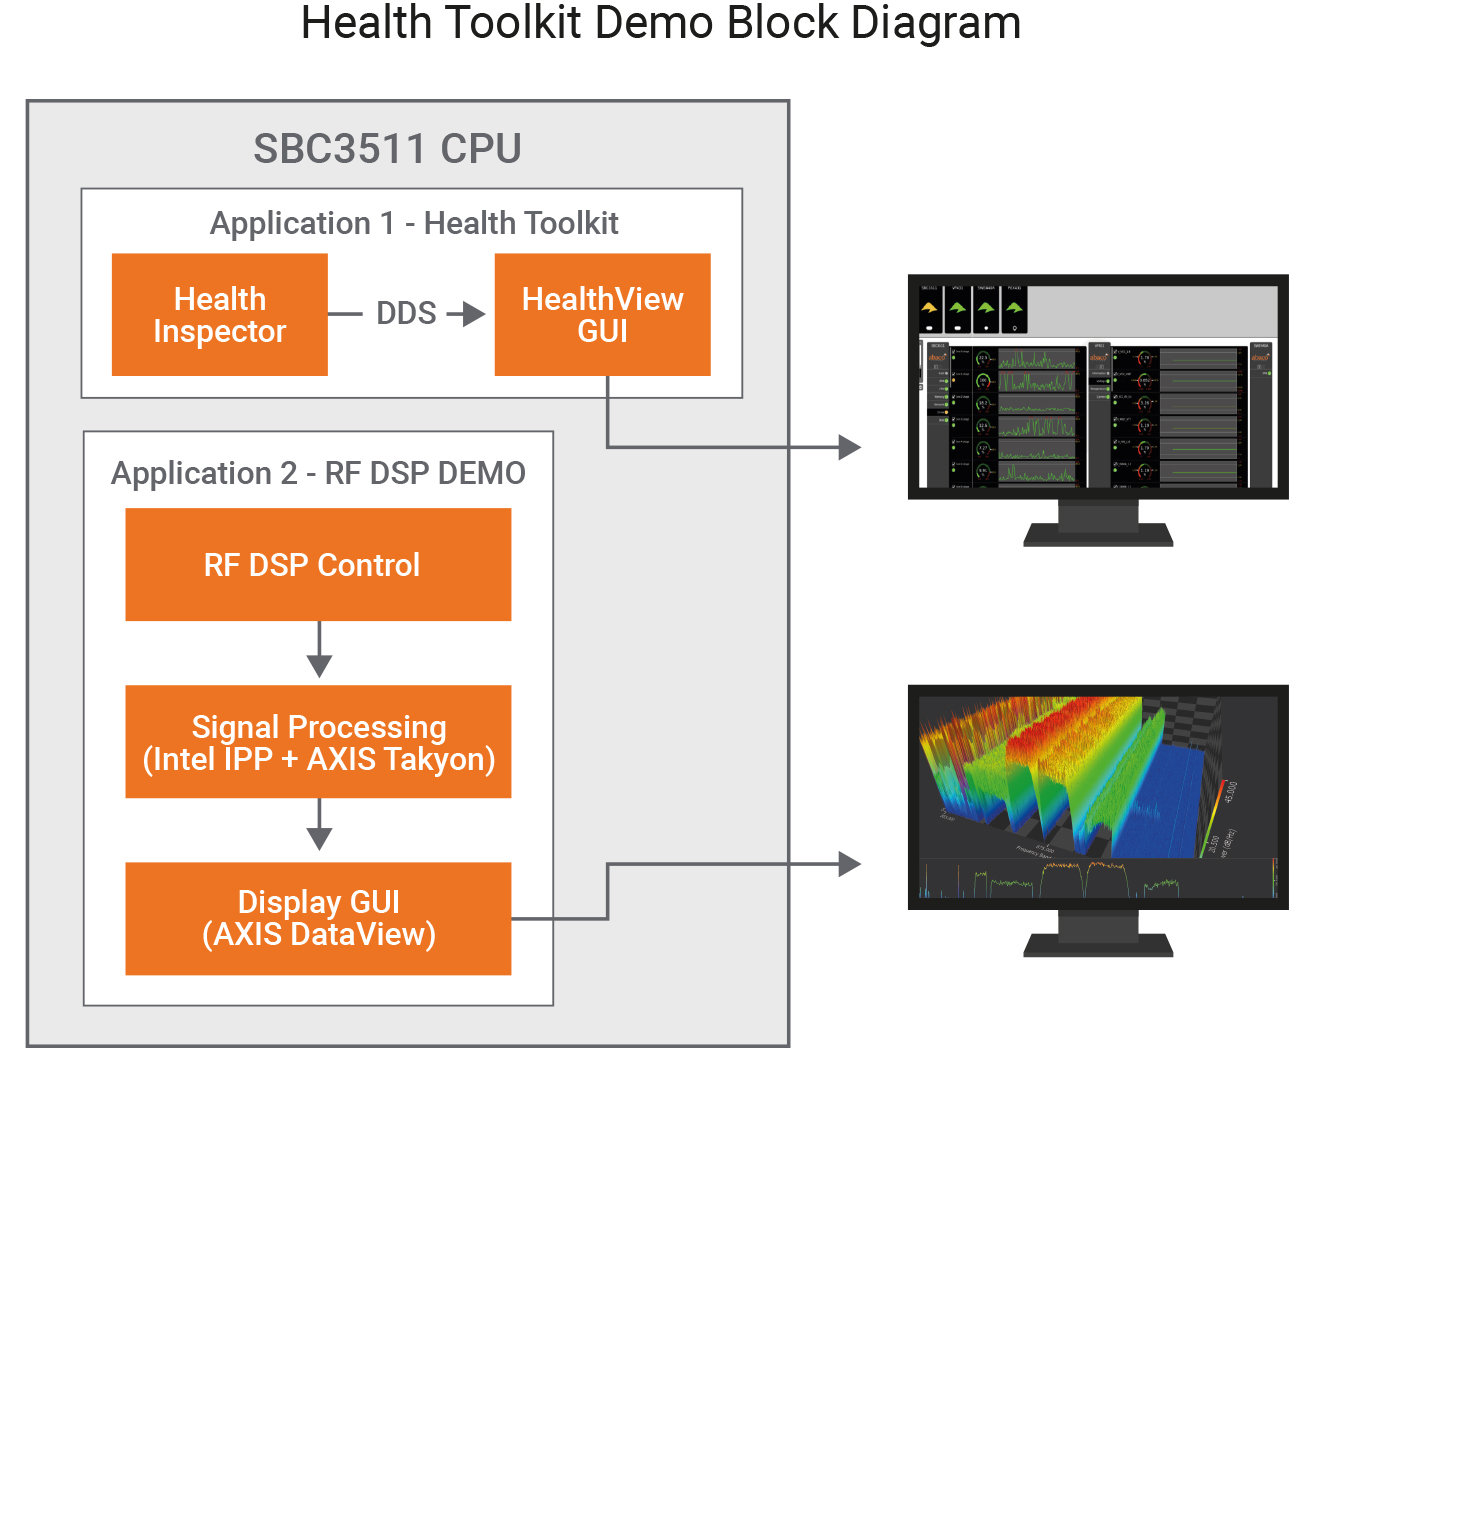
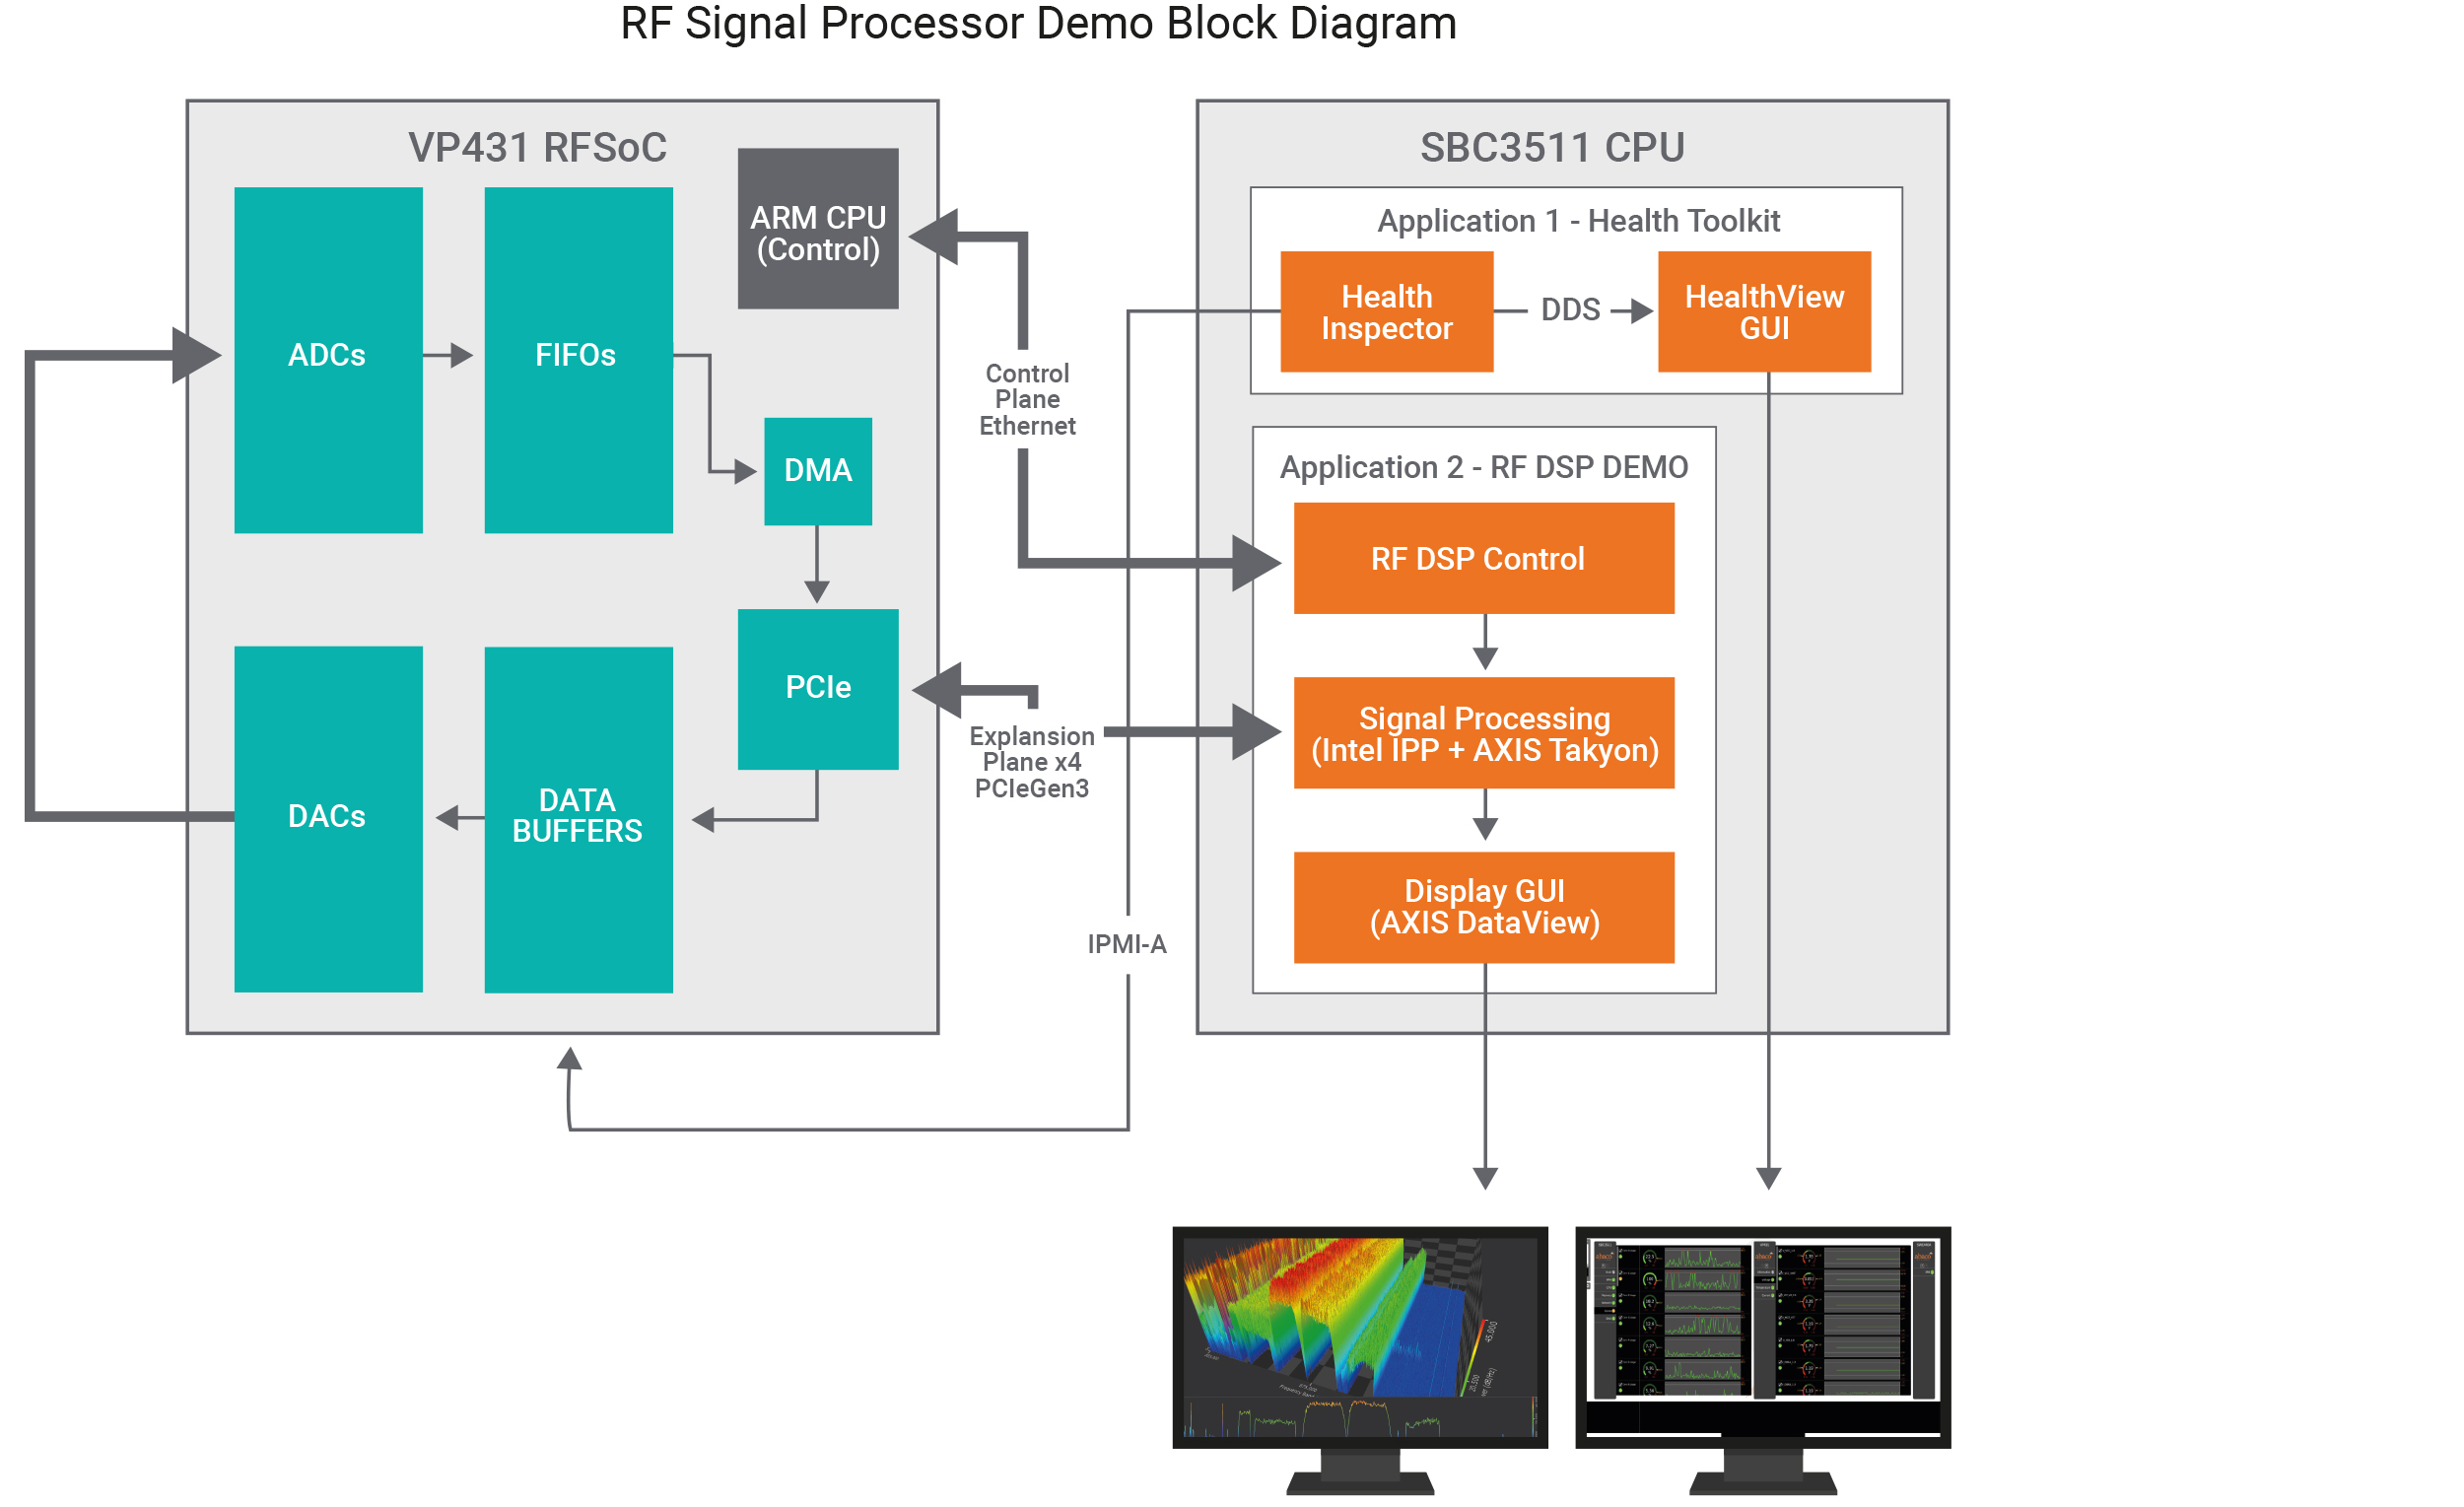
This demo shows RF signal transmission, ingest, transformation, processing, and visualization on three Abaco boards designed to align to the Open Group Sensor Open Systems Architecture™ (SOSA) standard and highlights data visualization and system health tools available for development and deployment.
RF Signal Processor Demonstration Detail
The single board computer is feeding a pre-recorded RF dataset to a DAC channel on the VP431. This DAC channel creates an RF signal which is looped back via an RF cable to an ADC channel on the VP431.
The ADC samples the incoming RF signal and performs a digital down conversion step before placing the sample data into a memory buffer in the FPGA. This data is then moved to Intel CPU memory on the SBC3511 via the PCIe interface using a DMA transfer. The data then goes through a signal processing stage on the Intel CPU to compute the power spectrum of the RF signal.
This power spectrum is then displayed in a rolling 3D waterfall plot, utilizing the Intel GPU and Abaco AXIS tool suite.
The control of the VP431 by the SBC3511 is facilitated by the SWE440S network switch which establishes the VPX control plane connectivity for the system.
The application can be easily extended to provide additional traditional signal processing or artificial intelligence (AI) based signal classification.
Health Toolkit Demonstration Detail
The Health Toolkit application monitors the activity and health of the VPX system as a background application.
The “Health Inspector agent” running on the SBC3511 collects utilization and sensor data from the SBC and other VPX boards via the IPMI interface over the backplane. It formulates this data into “topics” contained in a data model. It “publishes” these topics using the open standard DDS “publish / subscribe” middleware over the control plane network. Any “subscriber” on the control plane network can then access, monitor and act on this data.
The HealthView Dashboard subscribes to all published topics and displays in in a Graphical User Interface (HealthView GUI), which give a visual representation of the system activity and overall health. Key parameters such as CPU utilization, network activity, component temperatures and power rail voltage levels can be monitored. The published data can be stored in a database for future analytics.